Controller Console
The Console panel displays messages from your node graphs and the Controller application. Use it to monitor what’s happening behind the scenes, track down problems, and debug your creations.
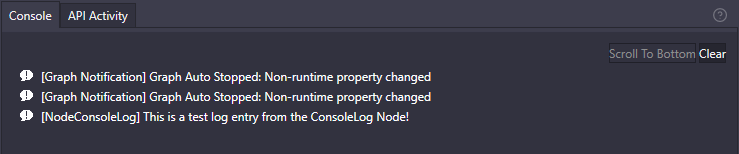
Understanding Console Messages
Section titled “Understanding Console Messages”Message Types
Section titled “Message Types”Each message in the console has an icon indicating its type:
| Icon | Type | Meaning |
|---|---|---|
| Info (white) | Log | General information about what’s happening |
| Warning (yellow) | Warning | Something might be wrong, but execution continues |
| Error (red) | Error | Something failed and needs your attention |
Message Format
Section titled “Message Format”Messages often include a prefix in square brackets showing where they came from:
[Graph Notification] Your node graph started successfully[OverMox Connection] Connected to OverMox projectCommon prefixes include:
- Graph Notification - Messages from running node graphs
- OverMox Connection - Status of the connection between Controller and OverMox
- Note Node - Output from Note nodes in your graphs
Working with the Console
Section titled “Working with the Console”Scrolling and Navigation
Section titled “Scrolling and Navigation”The console automatically scrolls to show new messages as they arrive. If you scroll up to review older messages, auto-scroll pauses so you can read without interruption.
- Scroll up - Mouse wheel or drag the scrollbar
- Scroll to Bottom - Click the “Scroll To Bottom” button to jump to the latest messages and resume auto-scroll
Viewing Long Messages
Section titled “Viewing Long Messages”Some messages may be too long to display fully in the list. Double-click any message to open it in a separate window where you can read the full text.
Finding the Source
Section titled “Finding the Source”When a message relates to a specific node or node graph, you can jump directly to it:

- Right-click the message
- Select Focus Source
- The editor navigates to the node or graph that generated the message
Clearing the Console
Section titled “Clearing the Console”Click the Clear button to remove all messages from the console. This is useful when:
- Starting a fresh debugging session
- The console has too many old messages
- You want to see only new messages from a specific test
Node Graph Execution Logs
Section titled “Node Graph Execution Logs”When your node graphs run, they generate messages showing what’s happening. These help you understand the flow of execution and catch problems early.
Common Execution Messages
Section titled “Common Execution Messages”| Message | Meaning |
|---|---|
| Connected to OverMox project | Controller successfully linked to your OverMox scene |
| Node is in limited state | Some features disabled until connected to a project |
| Version Mismatch | Controller and OverMox versions don’t match |
| Connection timed out | Communication with OverMox was lost |
Graph Notifications
Section titled “Graph Notifications”Node graphs can send notifications that appear both in the console and as visual alerts on the graph tab. Look for messages prefixed with [Graph Notification] to see these.
API Activity
Section titled “API Activity”The API Activity tab in the Console is a diagnostic view: a live log of recent API activity for troubleshooting. It is kept in memory only - it is not written to disk and clears when the OverMox app closes.
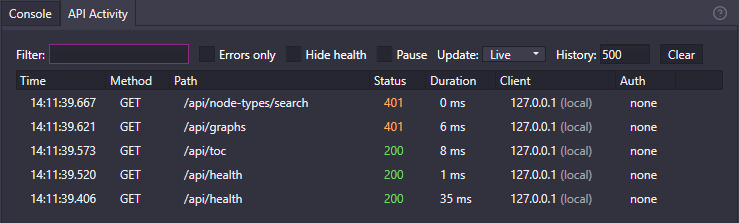
Each entry shows:
| Column | Description |
|---|---|
| Time | When the activity occurred |
| Method | The HTTP method (GET, POST, PUT, etc.) |
| Path | The endpoint that was hit |
| Status | The response status, color-coded by outcome |
| Duration | How long the request took |
| Client IP | The address the request came from |
| Auth | The authentication result for the request |
It records REST calls - including rejected and unauthorized ones and health checks - as well as events-hub connect and disconnect activity.
The tab provides these controls:
| Control | Effect |
|---|---|
| Filter | Free-text filter to narrow the visible entries |
| Errors only | Show only failed or rejected activity |
| Hide health | Hide routine health-check requests |
| Pause | Stop adding new entries while you inspect the list |
| Clear | Empty the current activity log |
Adding Custom Messages with the Log Node
Section titled “Adding Custom Messages with the Log Node”You can add your own messages to the console using the Log node (found in the Debug category). This is extremely helpful for understanding what your node graphs are doing.
How to Use the Log Node
Section titled “How to Use the Log Node”- Add a Log node to your graph
- Connect a trigger to start logging
- Enter the text you want to display in the Text input
- Connect the output trigger to continue your graph
Inputs
Section titled “Inputs”| Input | Type | Description |
|---|---|---|
| Trigger | Trigger | When triggered, sends the message to the console |
| Text | String | The message to display |
Outputs
Section titled “Outputs”| Output | Type | Description |
|---|---|---|
| Trigger | Trigger | Fires after the message is logged |
Example Uses
Section titled “Example Uses”- “Sub alert started” - Confirm a trigger fired
- “Viewer count: {count}” - Display variable values (using string interpolation)
- “Animation complete” - Mark when sequences finish
- “Error handler reached” - Catch unexpected conditions
Troubleshooting Common Issues
Section titled “Troubleshooting Common Issues”Connection Problems
Section titled “Connection Problems”“Failed to start local server for OverMox connection”
- Make sure OverMox is running before starting the Controller
- Check if another application is using the required port
- Restart both OverMox and the Controller
“Connection timed out”
- The Controller lost communication with OverMox
- Check if OverMox is still running
- You may need to restart the node graph controller
“Version Mismatch”
- Your Controller and OverMox versions are different
- Update both to the same version for reliable operation
Node Graph Errors
Section titled “Node Graph Errors”“Invalid array indexer”
- A Note node tried to access an array position that doesn’t exist
- Check that your array indices start at 0 and don’t exceed the array length
“Node is in limited state”
- The node needs a connected OverMox project for full functionality
- Make sure you’re connected to an active project
Save File Issues
Section titled “Save File Issues”“Save file has been converted to new version”
- Your save file was automatically updated to a newer format
- This is normal and your file should work correctly
“Failed to convert save file”
- A problem occurred during automatic file conversion
- A backup was created at the location mentioned in the message
- Contact support if the problem persists
Tips for Effective Debugging
Section titled “Tips for Effective Debugging”Related
Section titled “Related”- Variables Nodes - Working with variables in node graphs
- Flow Nodes - Controlling execution flow
- Hierarchy Panel - Finding and selecting scene objects