Node Graph Panel
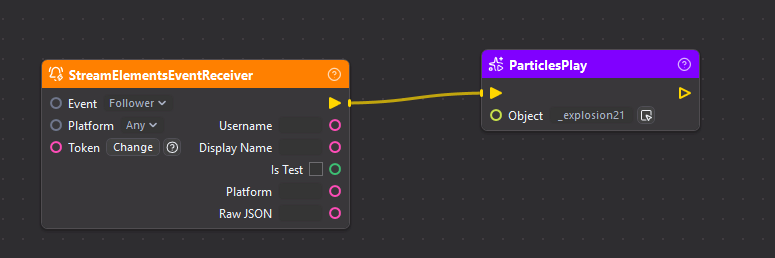
The Node Graph panel is where you build visual scripts by connecting nodes together. Instead of writing code, you create logic by placing nodes on a canvas and drawing connections between them. Each node performs a specific action, and connections define how data and execution flow through your graph.
Understanding the Node Graph
Section titled “Understanding the Node Graph”What is a Node Graph?
Section titled “What is a Node Graph?”A node graph is a visual script. Rather than typing lines of code, you:
- Place nodes on a canvas (each node does something specific)
- Connect nodes with wires (connections define flow)
- Run the graph to execute your logic
When a viewer tips and you play a sound effect, animate a 3D model, or spawn confetti, those actions are defined by nodes connected together in a graph.
Key Terminology
Section titled “Key Terminology”| Term | Description |
|---|---|
| Node | A single unit that performs one action or operation |
| Port | Connection points on nodes (inputs on left, outputs on right) |
| Wire | A connection line between two ports |
| Process | A running execution of a node graph |
| Trigger | A special port that controls execution flow (white arrows) |
Opening and Managing Graphs
Section titled “Opening and Managing Graphs”Creating a New Graph
Section titled “Creating a New Graph”- Go to File > New Graph or press
Ctrl + N - Name your graph (use descriptive names like “Donation_Alert” or “Confetti_Burst”)
- The new graph opens in a tab
Opening Existing Graphs
Section titled “Opening Existing Graphs”Graphs automatically open when OverMox connects to a project. You can also:
- Use File > Open Graph to browse for
.ovgraphfiles - Double-click a graph file in your project folder
Working with Multiple Graphs
Section titled “Working with Multiple Graphs”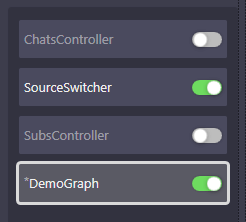
Each graph opens in its own tab. Click tabs to switch between graphs. Changes are saved automatically.
Navigating the Canvas
Section titled “Navigating the Canvas”Panning (Moving the View)
Section titled “Panning (Moving the View)”| Method | How |
|---|---|
| Middle mouse drag | Click and drag with middle mouse button |
| Right mouse drag | Click and drag with right mouse button |
| Arrow keys | Nudge the view in any direction |
Zooming
Section titled “Zooming”| Method | How |
|---|---|
| Scroll wheel | Scroll up to zoom in, down to zoom out |
| Zoom to fit | Press Home to fit all nodes in view |
Creating Nodes
Section titled “Creating Nodes”Using the Right-Click Menu
Section titled “Using the Right-Click Menu”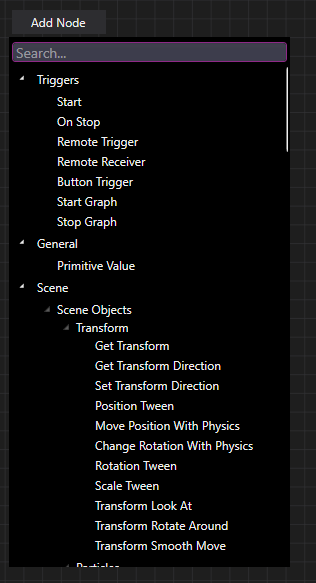
- Right-click anywhere on the canvas
- Browse categories or type to search
- Click a node to place it at your cursor
Searching for Nodes
Section titled “Searching for Nodes”The search bar in the right-click menu lets you find nodes by name:
- Type “delay” to find the Delay node
- Type “animation” to see all animation-related nodes
- Type “donation” to find the StreamElements and StreamLabs event nodes
Node Categories
Section titled “Node Categories”Nodes are organized into categories based on what they do:
| Category | Purpose | Examples |
|---|---|---|
| Triggers | Start your graph running | Button Trigger, Start |
| Flow | Control execution order and timing | Delay, Conditional, For Loop |
| Animations | Play and control animations | Play Animation, Stop Animation |
| Audio | Sound playback and control | Play Audio, Stop Audio |
| Scene Objects | Manipulate objects in your scene | Spawner, Tween, Set Transform |
| Variables | Store and retrieve data | Get Variable, Set Variable |
| Math | Calculations and comparisons | Add, Multiply, Comparison |
| Web | External service integration | StreamElements Event Receiver, HTTP Request |
| Text | String manipulation | Text Formatter, Text Parser |
| Components | Modify object behaviors | Set Property, Add Component |
See the Nodes Reference for complete documentation of all available nodes.
Connecting Nodes
Section titled “Connecting Nodes”Understanding Ports
Section titled “Understanding Ports”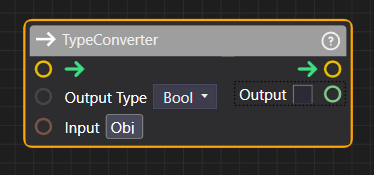
Nodes have ports for connections:
- Input ports appear on the left side of a node
- Output ports appear on the right side of a node
- Trigger ports (white arrows) control execution flow
- Data ports (colored circles) pass values like numbers, text, or colors
Drawing Connections
Section titled “Drawing Connections”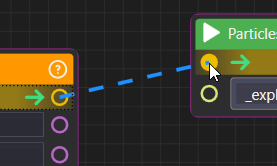
- Click and hold on an output port
- Drag to an input port on another node
- Release to create the connection
A wire appears showing the connection. Data flows from output to input, left to right.
Port Compatibility
Section titled “Port Compatibility”Not all ports can connect:
- Trigger to Trigger - Execution flow connections
- Data type matching - Numbers connect to numbers, text to text, etc.
- Some ports auto-convert - A number port might accept an integer or float
When dragging a connection, compatible ports highlight to show valid targets.
Disconnecting Wires
Section titled “Disconnecting Wires”Right-click on a wire to delete it, or:
- Click on the input port end of a wire
- Drag it away and release on empty canvas
Working with Nodes
Section titled “Working with Nodes”Selecting Nodes
Section titled “Selecting Nodes”| Action | How |
|---|---|
| Select one node | Click on it |
| Add to selection | Ctrl + Click |
| Box select | Click and drag on empty canvas |
| Select all | Ctrl + A |
Selected nodes show a highlight border.
Moving Nodes
Section titled “Moving Nodes”- Click and drag selected nodes to move them
- Hold Shift while dragging for axis-locked movement
- Multiple selected nodes move together
Deleting Nodes
Section titled “Deleting Nodes”| Method | Shortcut |
|---|---|
| Press Delete key | Delete |
| Right-click > Delete | - |
Deleting a node also removes all its connections.
Copy and Paste
Section titled “Copy and Paste”| Action | Shortcut |
|---|---|
| Copy | Ctrl + C |
| Paste | Ctrl + V |
| Duplicate | Ctrl + D |
Pasted nodes appear near the original with connections preserved between copied nodes.
Execution and Processes
Section titled “Execution and Processes”How Graphs Run
Section titled “How Graphs Run”A graph runs when a trigger node fires:
- A trigger node activates (button press, stream event, timer, etc.)
- Execution flows through connected trigger ports
- Each node performs its action in sequence
- The Process continues until it reaches an endpoint
Running a Graph Manually
Section titled “Running a Graph Manually”Click the Play button or press F5 to run the graph. This triggers any Button Trigger nodes in your graph.
Understanding Processes
Section titled “Understanding Processes”A Process is a single running instance of your graph:
- Multiple processes can run simultaneously
- Each process tracks its own state
- Use Process Management nodes to control running processes
See Process Management Nodes for details on managing concurrent processes.
Stopping Execution
Section titled “Stopping Execution”Click the Stop button or press Shift + F5 to stop all running processes in the current graph.
Organizing Your Graphs
Section titled “Organizing Your Graphs”Using Note Nodes
Section titled “Using Note Nodes”Add notes to explain complex sections:
- Right-click > Misc > Note
- Click the note to edit its text
- Use notes to document what sections of your graph do
Grouping Related Nodes
Section titled “Grouping Related Nodes”Keep your graphs readable by:
- Placing related nodes close together
- Using consistent left-to-right flow
- Leaving space between logical sections
- Adding notes for complex sections
Naming Conventions
Section titled “Naming Conventions”Use clear names for your graphs:
Donation_Alert_v2- Purpose and versionFollower_Confetti_Burst- Action descriptionCamera_Shake_On_Sub- Trigger and effect
Real-Time Visualization
Section titled “Real-Time Visualization”Execution Highlighting
Section titled “Execution Highlighting”When a graph runs, you see execution in real-time:
- Active nodes show a highlight or glow
- Data values update on ports
- Wires may animate to show data flow
This helps you debug and understand how your graph executes.
Port Value Preview
Section titled “Port Value Preview”Hover over connected ports to see current values. This shows what data is flowing through your graph during execution.
Tips for Effective Graphs
Section titled “Tips for Effective Graphs”Keyboard Shortcuts
Section titled “Keyboard Shortcuts”| Action | Shortcut |
|---|---|
| New graph | Ctrl + N |
| Save | Ctrl + S |
| Undo | Ctrl + Z |
| Redo | Ctrl + Y |
| Copy | Ctrl + C |
| Paste | Ctrl + V |
| Duplicate | Ctrl + D |
| Delete | Delete |
| Select all | Ctrl + A |
| Run graph | F5 |
| Stop graph | Shift + F5 |
| Zoom to fit | Home |
Common Streaming Examples
Section titled “Common Streaming Examples”Donation Alert Sequence
Section titled “Donation Alert Sequence”- StreamElements Event Receiver with Event set to Tip triggers on each tip
- Play Animation shows the alert graphic
- Delay waits 3 seconds
- Play Animation fades out the alert
Follower Celebration
Section titled “Follower Celebration”- StreamElements Event Receiver with Event set to Follower triggers on each new follow
- Spawner creates confetti particles
- Play Audio plays celebration sound
- Delay waits 5 seconds
- Particles Clear removes confetti
Interactive Chat Command
Section titled “Interactive Chat Command”- StreamElements Event Receiver with Event set to Chat triggers on each chat message
- Comparison checks whether the message is “!dance”
- Conditional continues only when the Comparison result is true
- Cooldown prevents spam (10 second cooldown)
- Play Animation triggers dance on your avatar
- Delay waits for animation length
- Reset Animation returns to idle
Related
Section titled “Related”- Nodes Reference - Complete documentation for all node types
- Variables Nodes - Storing and using data
- Flow Nodes - Controlling execution flow
- Process Management - Managing running graphs